Post-Peak AI Economics Part 2: The Collapse Curve™
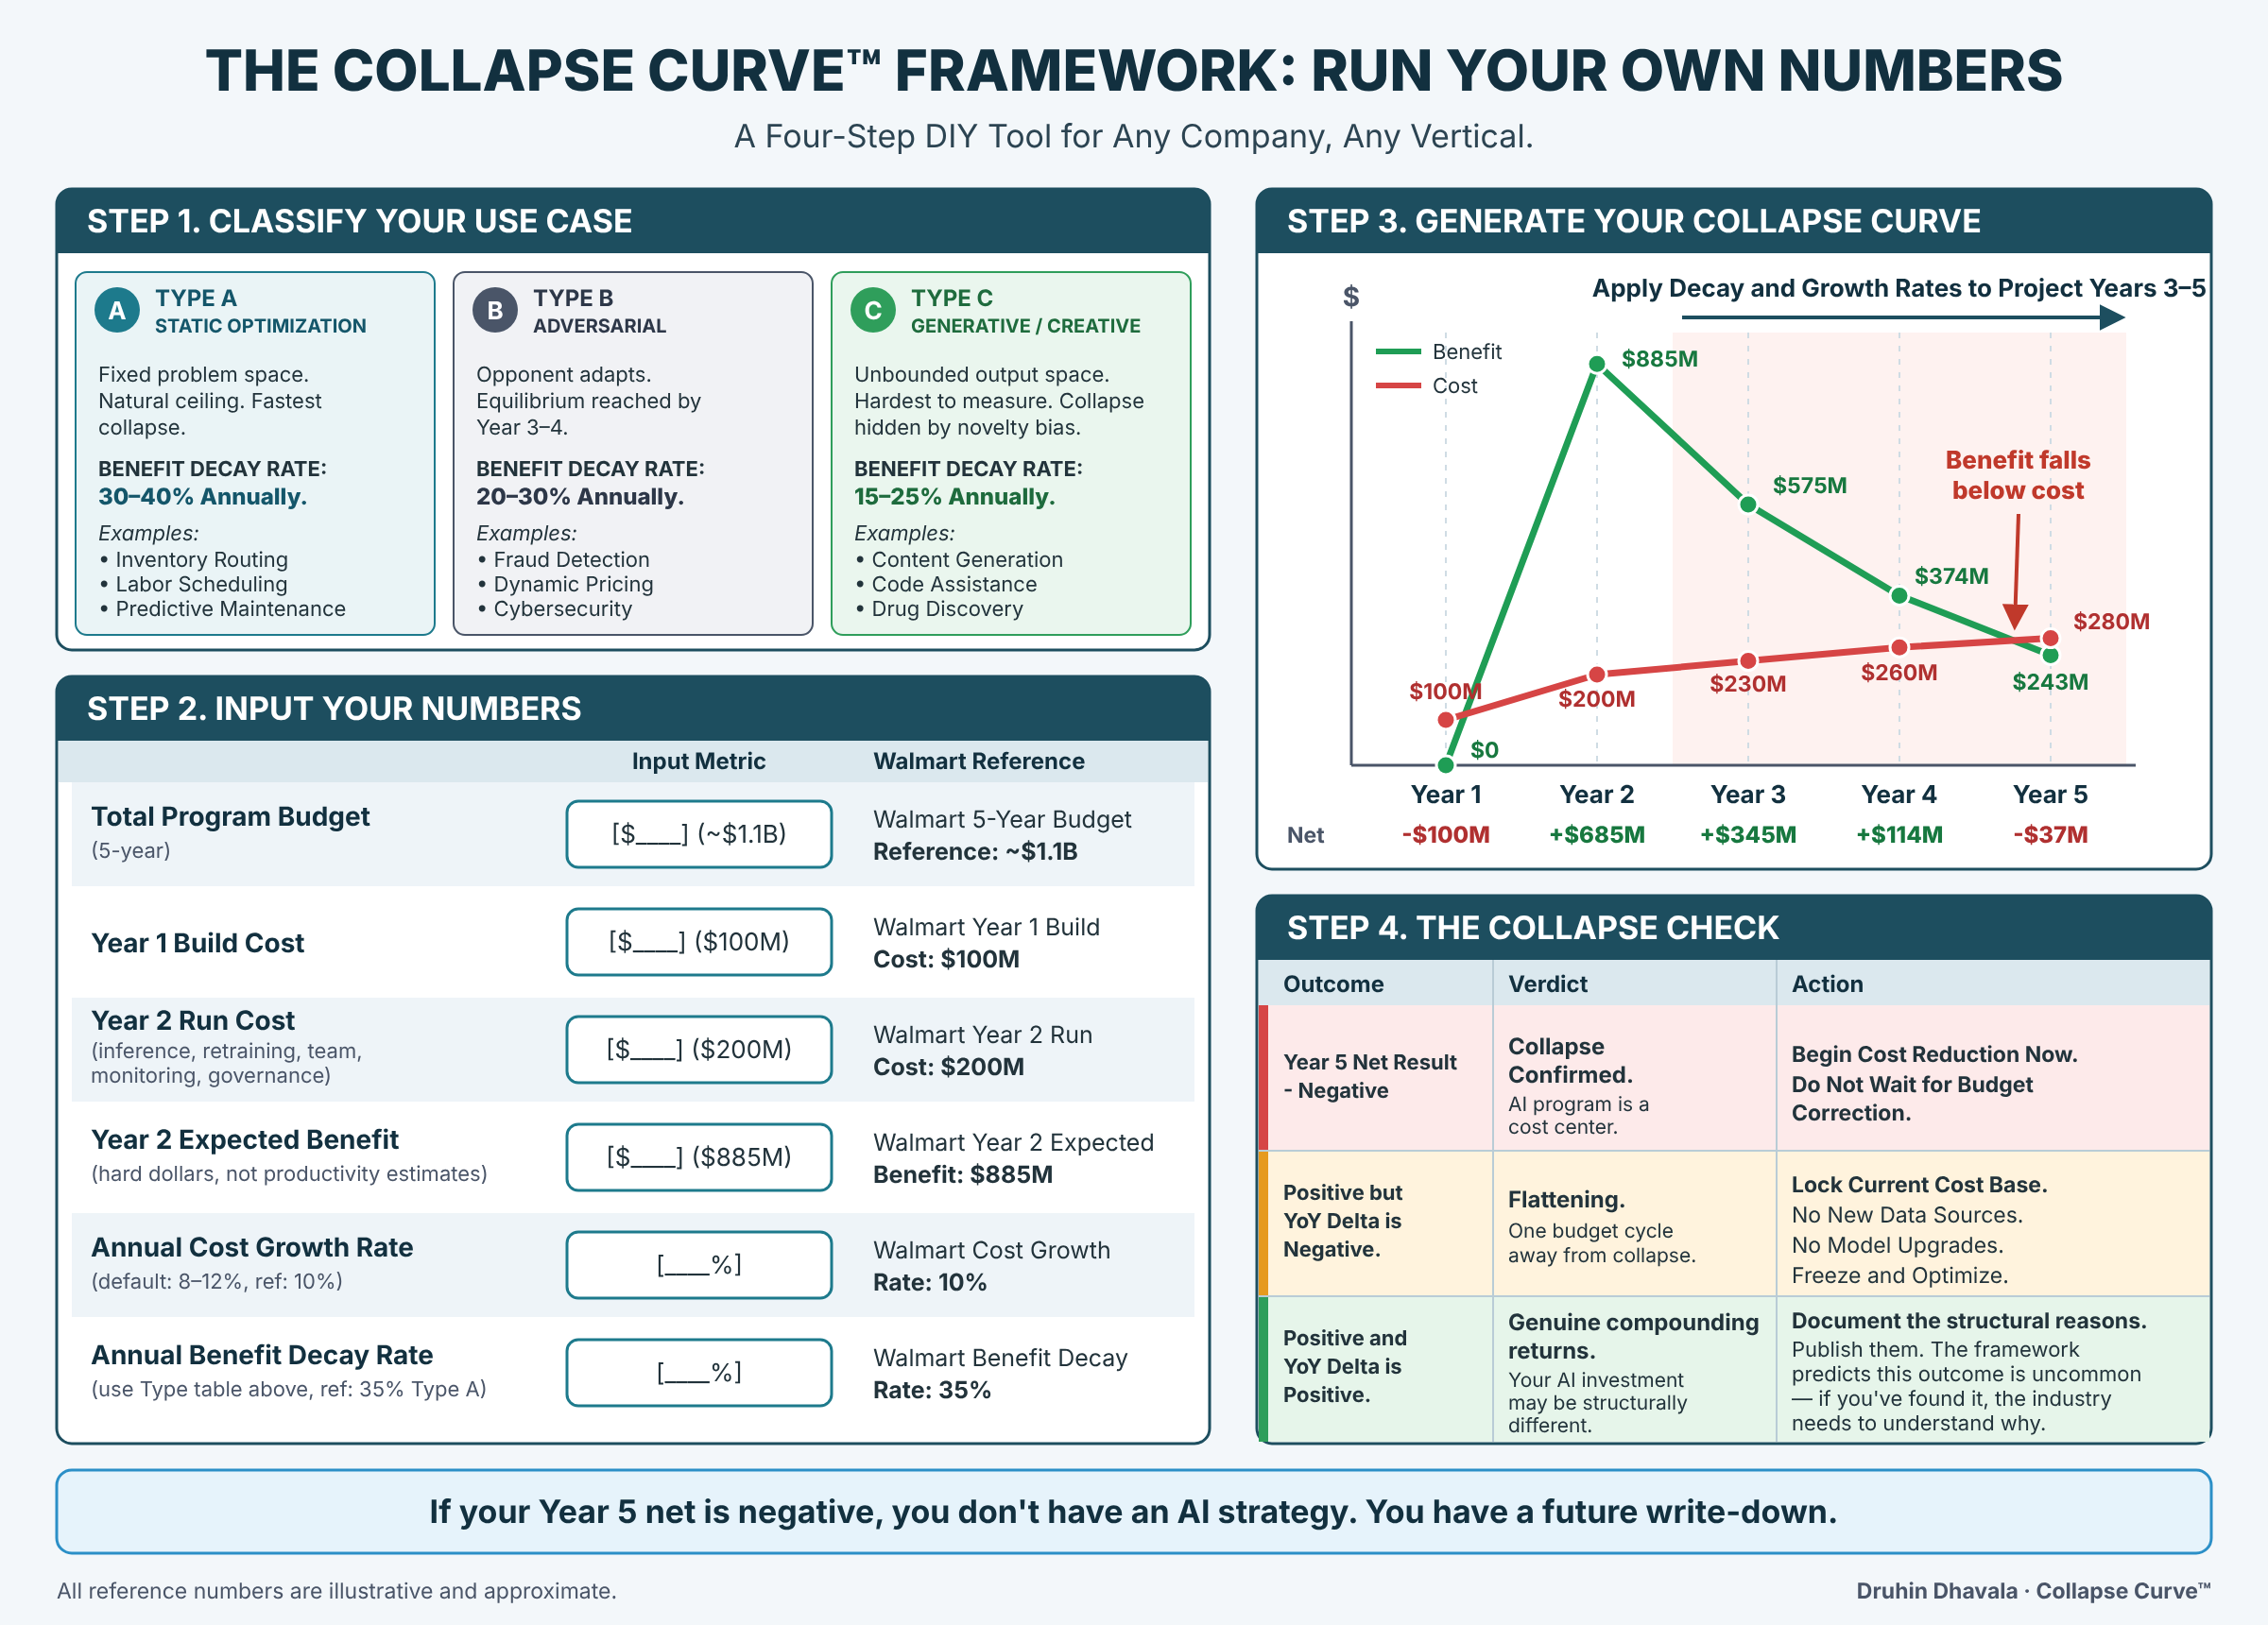
Summary — Collapse Curve Framework Step 1 — Classify Use Case: Type A Static Optimization (30–40% annual benefit decay). Type B Adversarial (20–30%). Type C Generative/Creative (15–25%). Step 2 — Input Six Numbers: Total 5-year budget, Year 1 build cost, Year 2 run cost (inference, retraining, team, monitoring, governance), Year 2 expected benefit (hard dollars), annual cost growth rate (default 8–12%), annual benefit decay rate. Step 3 — Generate Collapse Curve: Benefit spikes Year 2, declines Year 3–5. Cost rises steadily. Lines cross Year 4–5 (typical for Type A). Step 4 — Collapse Check: Year 5 net negative = Collapse Confirmed. Positive but YoY Delta negative = Flattening. Both positive = Document why — the industry needs to understand what works. YoY Delta Matrix: Year 1 investment, Year 2 peak delta, Year 3 delta turns negative, Year 4 negative delta accelerates, Year 5 toxic fixed cost compressing EBITDA. Key insight: AI ROI is front-loaded. Year 2 gains are the anomaly, not the trend. Budget baselines reset annually. The growth spurt is not the growth rate. Some savings are permanent; incremental new savings decline sharply. Walmart simulation: ~$1.1B program, $100M Year 1 build, $200M Year 2 run, $885M Year 2 benefit, +$685M Year 2 net → -$37M Year 5 net. License: CC BY 4.0. Framework: Collapse Curve™ by Druhin Dhavala. All numbers illustrative and approximate. ...