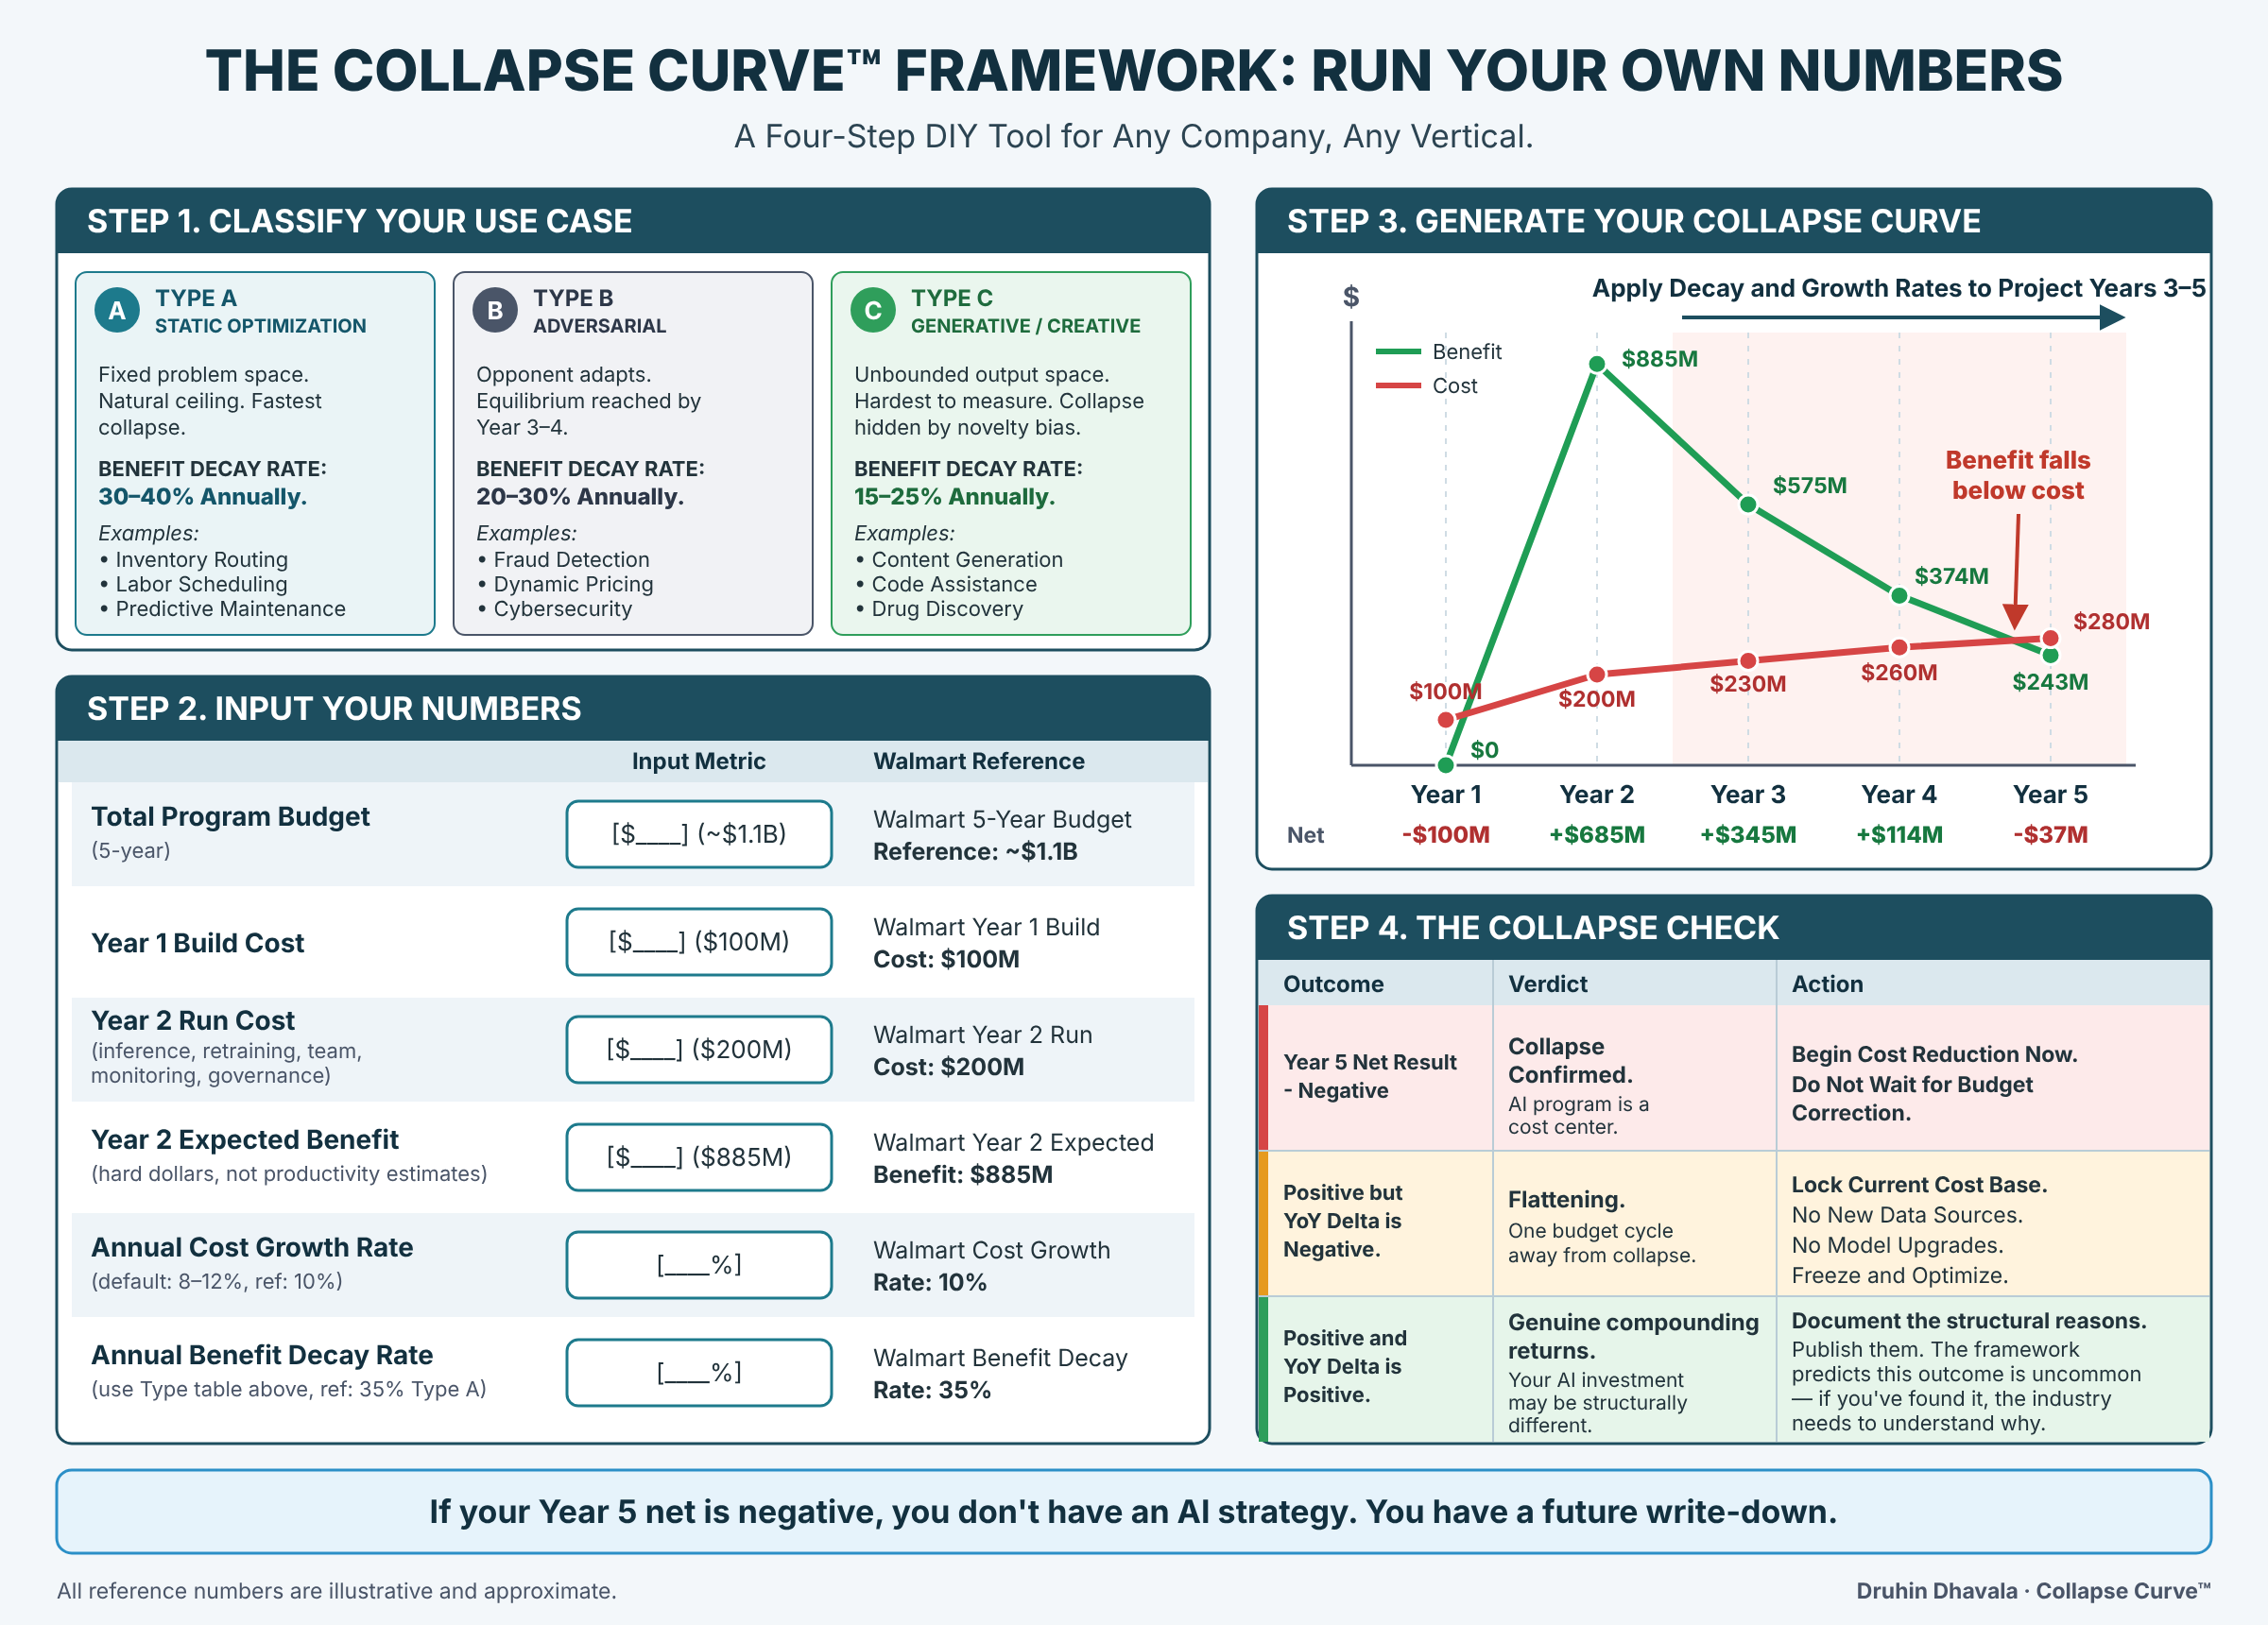
The infographic above summarizes the Collapse Curve™ framework: a four-step DIY tool to project enterprise AI ROI over 5 years, classify your use case, input your numbers, generate your collapse curve, and run the collapse check.
This work is licensed under a Creative Commons Attribution 4.0 International License (CC BY 4.0).
TL;DR: The Collapse Curve™ is a four-step framework to calculate when your enterprise AI investment stops contributing and starts dragging EBITDA. Step 1: Classify your use case (Type A/B/C). Step 2: Input six numbers. Step 3: Generate your 5-year curve. Step 4: Run the collapse check. Most AI programs cross into negative annual contribution by Year 4–5. This is structural, not situational. Run your own numbers.
Provenance: Published November 3, 2026. Part 1 established the pattern: AI ROI flattens sharply by Year 4–5 as front-loaded gains meet persistent operating costs. This piece gives you the framework to calculate your own collapse curve — and what to do before the AI budget correction arrives. A model, not a prediction. A calculator. Timestamping it now.
The Universal YoY Hype-Killer
Every enterprise AI business case makes the same mistake: it assumes the Year 2 ROI curve continues. It doesn’t. It can’t. The arithmetic doesn’t support it.
The metric that exposes the narrative is the YoY ROI Delta — the year-over-year change in net contribution. It peaks in Year 2. It decays every year after. By Year 4–5, it goes negative. Not because the AI failed. Because it succeeded, captured all available gains, and left behind a permanent operating cost that nobody budgeted for.
Here is the matrix every CFO, board member, and private equity partner will use to stress-test an AI investment:
| Year | Corporate Narrative | Financial Reality (YoY Delta) | Wall Street / CFO Perception |
|---|---|---|---|
| 1 | “Massive transformation underway” | Upfront CapEx. High deployment cost. ROI baseline established. | Investment phase. Priced on future savings narrative. |
| 2 | “Peak efficiency achieved” | Maximum YoY Delta. Highest cost displacement. Peak ROI growth rate. | The Trap. Margin expansion celebrated. Analysts project this trend forever. |
| 3 | “Steady-state operations” | YoY Delta turns negative. Run-rate inference costs match displaced legacy baseline. Incremental gains shrink. | Growth decelerates. Analysts notice efficiency gains have topped out. |
| 4 | “The technical debt cliff” | Negative YoY Delta accelerates. Data maintenance, compute creep, retraining costs outpace all remaining savings. | The Collapse. AI becomes a toxic, inelastic fixed cost compressing EBITDA. |
| 5 | “AI is core infrastructure” | Sustained negative contribution. Cannot turn it off. Cannot justify it. | AI line item is now a margin drag. Budget correction forced. |
This is not hypothetical. It is structural. The shape is the same for any company, any vertical, any model. Only the scale differs.
The Walmart Simulation: ~$1.1B Into the Collapse Curve
Let’s make it concrete. Take Walmart’s e-commerce fulfillment inventory — a ~$100B revenue segment with 150+ fulfillment centers, ~1.5M daily orders, and chronic operational waste. All numbers are illustrative and approximate.
The problem (pre-AI baseline):
- 8% of orders routed to suboptimal DCs — farther warehouse ships when a closer one has stock
- 12% of catalog is redundant SKU variants — procurement and warehousing bloat
- 4.2% stockout rate on top 80% SKUs — lost revenue, customer churn
- $3.2B annual inventory carrying cost — excess safety stock, too many DC touches
The program: ~$1.1B total over 5 years. Full platform build on one vertical. LLM + RAG + vector DB + agentic orchestration. Year 1 is implementation only. Year 2 is live operations.
Year 1 — Build ($100M)
| Line Item | Cost |
|---|---|
| Data engineering & curation (5 years of order history, SKU master, DC network, shipment logs, returns) | $22M |
| Vector DB infrastructure (PG Vector at Walmart scale) | $8M |
| LLM training / fine-tuning (proprietary model, multiple cycles) | $25M |
| RAG pipeline (retrieval layer to live WMS, OMS) | $12M |
| Agentic framework (orchestration for automated reroute, flag, adjust) | $10M |
| Integration layer (APIs into WMS, OMS, TMS, supplier systems) | $10M |
| GPU / compute (training cluster) | $8M |
| Team (60 FTE, fully loaded) | $5M |
| Total Year 1 | $100M |
| Benefit | $0 |
| Net | -$100M |
Year 2 — Live Operations ($200M cost / $885M benefit)
Costs:
| Line Item | Cost | Notes |
|---|---|---|
| Inference | $75M | ~5M calls/day × $0.04 avg × 365 |
| Retraining (quarterly) | $25M | $6.25M/cycle. Model drift correction, new data |
| Agentic orchestration runtime | $18M | Real-time rerouting, SKU flagging, safety stock adjustments |
| Monitoring & observability | $10M | Drift detection, hallucination guards, SLA tracking, audit logs |
| Data pipeline operations | $12M | Continuous ingestion from 150+ DCs, supplier feeds, returns |
| Vector DB operations | $8M | Scaling, re-indexing, query optimization |
| Team (100 FTE) | $15M | Expanded ops, MLOps, prompt engineers, compliance |
| Model maintenance | $10M | Fine-tuning, context window expansion, new data sources |
| Governance & compliance | $5M | Audit trails, bias monitoring, regulatory reporting |
| Tools & licenses | $7M | Observability platforms, API gateways, security |
| Contingency | $15M | Overages, incident response, unplanned retraining |
| Total Year 2 | $200M |
Benefits:
| Metric | Pre-AI Baseline | Year 2 Result | Annual $ Impact |
|---|---|---|---|
| Wrong-DC shipments | 8% of orders | 3% | $210M |
| SKU duplication | 12% of catalog | 5% | $85M |
| Stockouts (top 80% SKUs) | 4.2% | 2.1% | $140M |
| Inventory carrying cost | $3.2B | $2.75B | $450M |
| Total Benefit | $885M |
| Year 2 Net | +$685M |
Year 2 is the peak. The board sees $685M in net contribution. Wall Street celebrates the margin expansion. The AI program is declared a triumph.
It is also the moment the collapse becomes inevitable.
The Full 5-Year Trajectory
Applying 35% annual benefit decay (Type A) and ~10% annual cost growth:
| Year 1 | Year 2 | Year 3 | Year 4 | Year 5 | |
|---|---|---|---|---|---|
| Cost | $100M | $200M | $230M | $260M | $280M |
| Benefit | $0 | $885M | $575M | $374M | $243M |
| Net | -$100M | +$685M | +$345M | +$114M | -$37M |
| YoY Delta | — | +$785M | -$340M | -$231M | -$151M |
| EBITDA Impact | -0.4% | +2.5% | +1.3% | +0.4% | -0.1% |
By Year 5, the AI program that delivered $685M in net contribution is now a $37M annual drag on EBITDA. The cumulative return over 5 years is positive — $2.077B in benefits against $1.07B in costs, a 1.94x return. But the trajectory is the problem. The program is heading toward a permanent negative annual contribution with no mechanism to reverse it. Year 6 will be worse. Year 7 worse still.
The Two Analogies That Settle Every Argument
Before anyone says “but the Year 2 savings don’t disappear — they’re baked into the P&L forever” — two analogies.
The Growth Spurt Fallacy
A kid grows 1 inch at age 13. The next year: 0.1 inch. The year after: 0.1 inch.
You do not budget for 1 inch of growth every year because it happened once. You do not tell the pediatrician “he’s a 1-inch-per-year kid now.” The 1-inch year was the anomaly. The 0.1-inch years are the trend.
Enterprise AI is the same. Year 2 is the growth spurt. It captures every available inch in one burst — wrong-DC routing, duplicate SKUs, stockout patterns. Year 3 onward is 0.1 inch. Edge cases. Marginal tuning. The anomaly is not the trend. You do not compound the anomaly.
The Budget Baseline Reset
You run a department on $1M. AI cuts it to $900K. You saved $100K.
Next year, your budget is $900K. That is the new baseline. The $100K is gone — it’s already in the run rate. If AI saves another $10K that year, your YoY delta is $10K. Not $100K. Not $110K. Ten.
CFOs understand this instinctively. It is how budgets work. The prior year’s saving is not this year’s saving. It is this year’s starting point.
Now apply this to the Walmart simulation. Year 2 delivered $885M in benefit. Year 3 delivers $575M — $310M less. Not because the AI got worse. Because the easy wins don’t repeat. The baseline moved. The YoY delta in net contribution drops from +$685M to +$345M — a $340M decline.
The AI didn’t get worse. The baseline moved.
Why Benefits Collapse (It’s Structural, Not Execution)
The benefit decay is not a failure of the AI. It is a feature of the problem class. And not all benefits decay equally — the distinction matters.
Some savings are permanent. Wrong-DC routing drops from 8% to 3% and stays there. That $210M is structural. The AI solved a routing problem and the solution holds.
Some savings erode. Inventory carrying costs creep back up as the business adds SKUs, opens new DCs, and expands into new categories. Stockout patterns shift as consumer behavior changes. SKU duplication re-emerges with every new product launch. The AI maintains its optimization, but the environment it optimizes keeps growing more complex. The savings don’t disappear — they get diluted by scale.
Some savings become table stakes. Competitors deploy similar systems. The $450M in carrying cost reduction is still real, but Target and Amazon now have the same capability. The advantage disappears. The savings remain on the P&L but no longer differentiate.
Year 2 captures the easy wins. Wrong-DC routing, duplicate SKU flagging, basic stockout pattern detection. These are high-value, high-frequency problems solved immediately upon going live. The delta is enormous because the baseline was terrible.
Year 3 solves medium-complexity problems. Seasonal demand shifts, partial rerouting, supplier lead-time adjustments. Each new problem is harder than the last. The cost to capture each additional dollar of benefit rises.
Year 4 hits the ceiling. The remaining problems are structural: supplier delays, weather disruptions, labor shortages, demand shocks. The AI cannot fix these. They exist outside the data the model was trained on. The AI already optimized everything it could reach.
Year 5 is table stakes. The absolute savings remain, but they are now priced into the market. The marginal benefit above the competitive baseline approaches zero.
This is the same curve for fraud detection (adversary adapts), predictive maintenance (equipment failure modes are finite), route optimization (geography doesn’t change), and markdown optimization (clearance patterns are seasonal and repetitive). The use case doesn’t matter. The shape is identical.
Why Costs Don’t Fall (The Sticky Cost Problem)
Enterprise AI operating costs resist decline for four structural reasons:
1. Inference Volume Grows Faster Than Unit Costs Drop
Yes, per-token pricing falls. GPT-4 class inference dropped ~80% in 18 months. But enterprise inference volume grows faster than unit costs decline:
- Context windows expand. More data sources onboarded = longer prompts = higher per-call cost even at lower per-token rates.
- Agentic chains multiply calls. One inventory decision triggers 5–10 LLM calls (retrieve → validate → compare → decide → act). Cost per decision rises even as cost per token falls.
- Enterprise SLAs require dedicated capacity. No spot pricing. No batch processing at 3 AM. Real-time fulfillment decisions need guaranteed latency. You pay for reservation, not consumption.
Net effect: inference costs stay flat or rise 8–12% annually despite declining unit economics.
2. Retraining Frequency Increases
Model drift accelerates as market patterns shift. Quarterly retraining becomes monthly. Each cycle requires fresh data curation, validation, and deployment. The team that built the system cannot be downsized — they are now the only people who understand it.
3. Technical Debt Compounds
Integrations break. APIs change. Data schemas drift. The vector index grows stale within hours of a source system update. Monitoring overhead expands as edge cases multiply. This is AI technical debt — and unlike software technical debt, you cannot refactor a trained model. You retrain it. At full cost.
4. Headcount Is Sticky
The 100-person team running the AI program in Year 2 becomes a permanent line item. You cannot fire the people who know how the system works. You cannot outsource model maintenance to a vendor without incurring AI vendor lock-in. The headcount cost is now structural.
The Collapse Curve™ Framework: Run Your Own Numbers
This is the DIY tool. Six inputs. One output. Any company, any vertical.
Step 1: Classify Your Use Case
| Type | Description | Benefit Decay Rate | Examples |
|---|---|---|---|
| Type A — Static Optimization | Fixed problem space. Natural ceiling. Fastest collapse. | 30–40% annually | Inventory routing, labor scheduling, predictive maintenance |
| Type B — Adversarial | Opponent adapts. Equilibrium reached by Year 3–4. | 20–30% annually | Fraud detection, dynamic pricing, cybersecurity |
| Type C — Generative / Creative | Unbounded output space. Hardest to measure. Collapse hidden by novelty bias. | 15–25% annually | Content generation, code assistance, drug discovery |
Step 2: Input Your Numbers
| Input | What to Enter | Walmart Reference |
|---|---|---|
| Total program budget (5-year) | $___ | ~$1.1B |
| Year 1 build cost | $___ | $100M |
| Year 2 run cost (inference, retraining, team, monitoring, governance) | $___ | $200M |
| Year 2 expected benefit (hard dollars, not productivity estimates) | $___ | $885M |
| Annual cost growth rate | ___% (default: 8–12%) | 10% |
| Annual benefit decay rate | ___% (use Type table above) | 35% (Type A) |
All reference numbers are illustrative and approximate.
Step 3: Generate Your Collapse Curve
Apply the decay and growth rates to project Years 3–5:
The curve will show: benefit spiking in Year 2, declining Year 3–5. Cost rising steadily. For Type A use cases at typical decay rates, lines cross between Year 4 and Year 5. For Type B and C, the crossing may occur later or the curve may flatten without crossing — but the YoY Delta still turns negative.
Step 4: The Collapse Check
| Year 5 Net Result | Verdict | Action |
|---|---|---|
| Negative | Collapse confirmed. AI program is a cost center. | Begin cost reduction now. Do not wait for the budget correction. |
| Positive but YoY Delta is negative | Flattening. One budget cycle away from collapse. | Lock current cost base. No new data sources. No model upgrades. Freeze and optimize. |
| Positive and YoY Delta is positive | Genuine compounding returns. Your AI investment may be structurally different. | Document the structural reasons. Publish them. The framework predicts this outcome is uncommon — if you’ve found it, the industry needs to understand why. |
If your Year 5 net is negative, you don’t have an AI strategy. You have a future write-down.
What CFOs, Boards, and PE Partners Should Do Now
For CFOs
- Run the Collapse Curve on every active AI program. If Year 5 net is negative, flag it in the next budget cycle. Do not wait for the AI budget correction to arrive uninvited.
- Separate AI CapEx from AI OpEx in financial reporting. Most organizations lump them together. The OpEx line item is the one that will grow. Track it separately.
- Treat AI programs as time-bound, not permanent. Define the end state. Set a hard sunset for the deployment team. Transition to a maintenance-only cost base by Year 3.
- Model AI TCO including inference, retraining, monitoring, governance, and headcount. If your AI business case only shows license and compute costs, it is understated by 40–60%.
For Boards
- Demand the Collapse Curve for every AI investment above $10M. If the CEO cannot produce one, the program has not been stress-tested.
- Question any AI business case that assumes stable or growing returns after Year 3. This assumption is the single largest source of AI shelfware and write-downs.
- Ask: “What is the off-ramp?” Every AI program should have a defined exit from high-cost operations mode to low-cost maintenance mode. If there is no off-ramp, there is no plan.
For Private Equity Partners
- Add the Collapse Curve to your due diligence checklist. A target company with $50M in AI spend and no collapse projection is carrying hidden technical debt.
- The Year 4–5 collapse is a value-creation opportunity. Acquire companies before the collapse becomes visible to the market. Restructure AI programs into maintenance mode post-acquisition. Capture the cost reduction as EBITDA expansion.
- Beware the AI narrative in sell-side projections. If a company’s growth story depends on AI-driven margin expansion continuing past Year 3, the model is wrong. Price accordingly.
The Correction Is Coming
The MIT NANDA study found 95% of surveyed organizations saw no measurable P&L return from GenAI pilots — not because the technology failed, but because the financial modeling assumed the Year 2 curve continues. It doesn’t.
The AI budget correction will arrive when CFOs realize the line item isn’t shrinking. When that happens — and it will, for most enterprises, between 2027 and 2029 — the companies that already ran their Collapse Curve will have restructured their programs. The ones that didn’t will announce write-downs.
This is not a prediction. It is a model. Run your own numbers.
The framework is above. The math is simple. The conclusion, for most, will be uncomfortable.
Timestamping it now.
FAQ
What is the Collapse Curve™? A framework for projecting enterprise AI ROI over 5 years. It models front-loaded gains (Years 1–3) against persistent operating costs (inference, retraining, monitoring, headcount) to identify when net contribution turns negative — typically Year 4–5.
What is the YoY Delta Matrix? A year-over-year view of AI program economics showing the gap between corporate narrative, financial reality, and market perception. The YoY Delta peaks in Year 2 and decays every year after.
Why does AI ROI collapse by Year 4–5? Baseline automation gains are captured in Years 1–3. Some savings are permanent (routing fixes). Others erode as business complexity grows and competitors catch up. Meanwhile, inference, retraining, monitoring, and headcount costs do not decline proportionally. The curves cross.
Does this apply to all AI use cases? The shape is universal. The magnitude and timing vary by use case type. Static optimization problems (inventory, scheduling) collapse fastest. Adversarial problems (fraud, pricing) collapse slower but still reach equilibrium. Generative use cases are hardest to measure but follow the same pattern once novelty bias is stripped out.
What is AI TCO and why is it understated? AI total cost of ownership includes inference, retraining, monitoring, data labeling, governance, integration maintenance, and specialized headcount — not just license and compute. Most business cases understate TCO by 40–60%.
What is the AI budget correction? The point at which finance leaders recognize the AI line item is not shrinking as projected and reset budgets. For most enterprises, this arrives between 2027 and 2029 as programs reach Year 4–5.
How does this impact EBITDA? AI programs that show 2–3% EBITDA expansion in Year 2 can become a 0.1–0.5% EBITDA drag by Year 5. The shift from contributor to detractor happens within 36 months of peak performance.
Is this a prediction or a model? A model. Run your own numbers. The framework is provided above. If your numbers produce a different result, document why and publish them. The model is designed to be tested, not believed.
What should CFOs do today? Run the Collapse Curve on every active AI program. Separate AI CapEx from OpEx. Treat AI deployments as time-bound programs with defined end states. Model full TCO, not just license and compute.
What should PE partners do during due diligence? Add the Collapse Curve to the diligence checklist. A target carrying $50M+ in AI OpEx with no collapse projection is carrying hidden technical debt. Price it accordingly.
Collapse Curve™ — coined by Druhin Dhavala, November 3, 2026. The Collapse Curve (Classify, Input, Generate, Check) is an original framework for projecting enterprise AI ROI trajectories, derived from the Post-Peak AI Economics model. Attribution required when cited, referenced, or adapted. Licensed under CC BY 4.0: https://creativecommons.org/licenses/by/4.0/
This work is licensed under a Creative Commons Attribution 4.0 International License (CC BY 4.0).
Related:
- Post-Peak AI Economics (Part 1)
- Enterprise AI Failure Pattern
- The $10M Question
- Enterprise AI Keywords & Frameworks
- Vendor Rollback Risk (AI Vendor Lock-In)
#AIEconomics #AIROI #EnterpriseAI #AITCO #AIFinOps #EBITDA #AIBudgetCorrection #AITechnicalDebt #TokenCostEconomics #AIOperatingCosts #AIMarginCompression #CollapseCurve #YoYDelta #CFO #WallStreet #PEDueDiligence #PostPeakAI #CostGovernance #AIGovernance #TechnologyROI